
- Printed Journal
- Indexed Journal
- Refereed Journal
- Peer Reviewed Journal


P-ISSN: 2664-844X
E-ISSN: 2664-8458

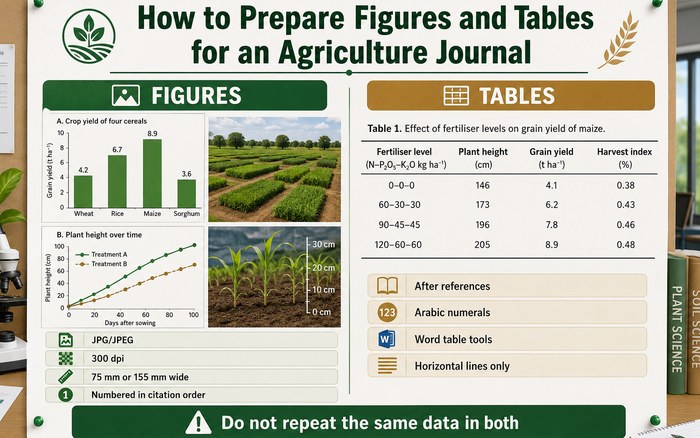
Figures must be JPG or JPEG at 300 dpi, 75 mm or 155 mm wide, each with a heading, numbered in citation order. Tables go after the references, numbered in Arabic numerals with self-descriptive headings, built with Word’s table tools, using horizontal lines only. The same data must not appear in both a table and a figure.
Figures are the most common production delay in agriculture journal papers, and almost always for the same reason: they were made for a screen and are being asked to print.
| Figures | Tables | |
|---|---|---|
| Format | JPG / JPEG in the Word file | Word table tools |
| Size | 75 mm or 155 mm wide | Full width as needed |
| Resolution | 300 dpi | — |
| Numbering | Arabic, in citation order | Arabic, in citation order |
| Heading | Fig 1: … (9 pt Times New Roman, bold) | Table 1: … (9 pt Times New Roman, bold) |
| Placement | In the text | After the references |
| Lines | — | Horizontal only, no vertical |
Screens display around 72 to 96 dots per inch. Print needs 300. A figure captured from a screen has 72 dpi of actual information, and no amount of enlarging or resaving adds any — it just makes the existing pixels bigger.
If you made the plot in software, export it from that software at 155 mm and 300 dpi. Do not screenshot it, do not copy it out of a presentation, and do not export from a PDF viewer.
The check takes ten seconds: look at the image file’s properties and divide the pixel width by the intended print width in inches. A 155 mm figure is about 6.1 inches, so 300 dpi means roughly 1,830 pixels wide. Anything much below that will not print.
This is the agriculture journal figure failure nobody catches on screen. A plot designed on a large monitor and then shrunk to 75 mm loses its axis labels entirely.
Then print the page on ordinary paper at actual size and look at it. Two minutes, and it catches everything an on-screen check misses.
In an agriculture journal the same conventions apply as in the text, and they are broken most often in table headings and axis labels because the software wrote them and nobody re-read them:
Captured from a screen, 72 dpi, often with a window border or cursor still visible. Cannot be fixed by resaving — it has to be re-exported from the original software.
Designed at screen size, shrunk to 75 mm. The data is perfect and the labels are 4 pt. Fix by setting the figure size first and enlarging fonts until they are readable at final size.
Five treatment lines distinguished by colour alone. In greyscale print they become five identical grey lines, and around one in twelve male readers cannot separate some of them on screen either. Add line styles, markers or hatching.
An image of a table. It cannot be copy-edited, cannot be searched, and prints at whatever resolution the screenshot had. Rebuild it with the table tools.
Figures and tables must be cited in the text in numerical order. Table 2 cannot be mentioned before Table 1. This sounds trivial until a paper is restructured during revision and the order silently breaks — worth re-checking after any significant rewrite.
Multi-part figures are marked with upper-case letters, A, B, C, in bold Times New Roman, and the labelling should be consistent across every figure in the paper.
Five minutes, and it removes the commonest cause of production delay after acceptance. The full specification is on the Instructions to Author page.
Long after the paper is published you will want a figure for a talk, a thesis chapter or a follow-up paper. If the only copy is the JPG that went into the manuscript, you are re-plotting from scratch.
Keep the plotting file, the data behind it and the export settings alongside the manuscript. It costs nothing today and saves an afternoon later — and if a reviewer asks for a figure redrawn at a different scale, you can do it in minutes.
| Use a | When | Because |
|---|---|---|
| Sentence | Two or three values | Faster to read than any table |
| Table | Exact values matter, or many treatments | Precision and easy comparison |
| Figure | A trend, shape or relationship | The eye reads a curve faster than a column |
| Both | Never | Explicitly not allowed here |
One habit prevents most of this: decide the final figure width before you make the plot, and set the software to it. Every downstream problem — unreadable labels, thin lines, wrong resolution — comes from designing at screen size and shrinking afterwards.
And if a figure is genuinely important to the argument, give it the 155 mm width rather than squeezing it into 75 mm to save a page. Space is cheaper than an unreadable result.
300 dpi, at a width of either 75 mm or 155 mm. A figure that looks correct on screen is usually 72 dpi and cannot be printed at this quality.
JPG or JPEG, placed in the Word file. Each figure needs a heading, and legends for all figures go on a separate page.
After the references. Each is numbered in Arabic numerals with a self-descriptive heading, built with Word's table tools, using a few horizontal lines and no vertical lines.
No. The instructions specifically say the same data should not be presented in both. Choose whichever form carries the point.
With upper-case letters — A, B, C — in bold Times New Roman, consistent across all figures in the paper.
Because screen resolution and print resolution are different things. A screenshot is typically 72 dpi and enlarging it adds no information. Export from the software that made the plot at the required width and 300 dpi.
The metrics that are often confused with indexing:
Created by Yuki Tanaka • 10 Aug 2026
P-ISSN: 2664-844X
E-ISSN: 2664-8458

International Journal of Agriculture and Food Science