
- Printed Journal
- Indexed Journal
- Refereed Journal
- Peer Reviewed Journal


P-ISSN: 2664-844X
E-ISSN: 2664-8458

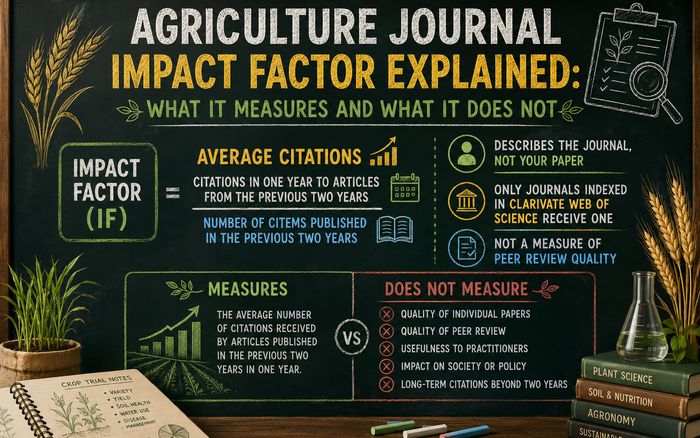
The Clarivate Journal Impact Factor is the average number of citations received in one year by the articles a journal published in the two previous years. It describes the journal, not any individual paper, and only journals indexed in Clarivate’s Web of Science receive one. Numbers issued by other organisations with similar names are not the same metric.
Authors are told to publish in high-impact agriculture journals without ever being told what the number counts. It is worth ten minutes, because the misunderstandings cost people real decisions.
The arithmetic is simple. For a 2026 impact factor:
Citations in 2026 to articles published in 2024 and 2025
÷
Number of citable articles published in 2024 and 2025
Two consequences follow immediately:
| Impact factor | |
|---|---|
| Describes | The journal, averaged over two years |
| Does not describe | Your paper |
| Does not measure | Quality of peer review |
| Does not measure | Whether your paper reaches the people who need it |
| Comparable across fields? | No — citation habits differ enormously |
| Available for every journal? | No — only Clarivate-indexed titles |
The second row matters most. Your paper’s value is its own citations and its own readers. A well-cited paper in a modest journal is worth more to you than an uncited one in a famous journal, and assessment panels increasingly say so.
In Indian agricultural research the NAAS score is the metric authors meet most, and it is frequently confused with an impact factor. They are different things calculated by different bodies.
| Clarivate Impact Factor | NAAS score | |
|---|---|---|
| Who issues it | Clarivate | National Academy of Agricultural Sciences |
| What it counts | 2-year citation average | Category I: 6.0 + Impact Factor (cap 20.00) Category II: publisher proforma + content evaluation |
| Who gets one | Web of Science indexed titles | Journals on the NAAS list |
| Revised | Annually | Annually |
The point most often got wrong: NAAS Category I and Category II are defined by whether the journal has a Clarivate Impact Factor, not by a score threshold. Because Category I starts at 6.0 by formula, every Category I journal scores above 6.0. Comparing a Category II score with a Category I score is not a like-for-like comparison. Our guide on what a NAAS rating is works through the methodology from the Academy’s own published criteria.
This is where authors get misled, and it is deliberate. Several organisations publish numbers with names close enough to the Clarivate figure to be mistaken for it, sometimes for a fee, with methods that are not disclosed.
One test settles it: can you identify who calculated the number, and find the method? The Clarivate figure appears in Journal Citation Reports and can be checked there. A number appearing only on a journal’s own homepage, credited to an organisation you cannot find independently, is marketing.
If an agriculture journal quotes an “impact factor” and you cannot find who issued it, treat the number as absent rather than as low.
| Metric | What it counts | Who publishes it |
|---|---|---|
| Journal Impact Factor | 2-year citation average | Clarivate (Journal Citation Reports) |
| CiteScore | 4-year citation average | Elsevier (Scopus) |
| SJR | Citations weighted by source prestige | Scimago |
| NAAS score | Formula or evaluation, see above | NAAS, India |
| h-index | Balances output and citations | Various |
They measure different windows and different sources, so they do not agree and are not meant to. Quoting one without naming which is how confusion starts — always give the metric, the year and the source.
Authors sometimes find one agriculture journal quoted with three different numbers on three different sites and assume someone is lying. Usually nobody is — the numbers count different things:
None of this makes the numbers useless. It makes them incomparable across systems — which is why any figure quoted without naming the system and the year should be treated as decoration.
Comparing metrics across agricultural sub-fields is the most common misuse, and it is easy to see why it fails once you look at the mechanics.
Food technology and post-harvest work generates citations quickly, from a large active community publishing short papers. Long-term soil fertility trials, agroforestry studies and germplasm characterisation produce fewer papers, read carefully by a smaller community, cited over a decade — and the two-year window closes before most of those citations arrive.
So a 1.8 in one sub-field can represent a stronger position among its peers than a 4.5 does in another. The only meaningful comparison is between journals a reader would genuinely consider as alternatives for the same paper.
One point authors rarely consider: the figure you see today describes citations to papers published two and three years ago. It says nothing about how the journal is run now.
An agriculture journal that changed editors, tightened its review or broadened its scope last year will not show any of that for another two to three years. If you are assessing a journal as it exists today, the review policy, the indexing, the charges and the archive tell you far more than a metric describing its past.
For deciding where to send a paper, these affect the outcome far more than any metric:
Our guide on choosing an agriculture journal works through all of these as a one-hour check.
The Clarivate Journal Impact Factor is the average number of citations in one year to the articles a journal published in the two preceding years. It is calculated by Clarivate and published in Journal Citation Reports; only journals indexed there receive one.
No. Only journals indexed in Clarivate's Web of Science Core Collection get one. A journal without it is not automatically weak — it simply is not in that index. Most Indian agriculture journals are not.
They are calculated by different bodies for different purposes. The Clarivate figure is a citation average. The NAAS score is assigned by the National Academy of Agricultural Sciences: for journals with a Clarivate Impact Factor it is 6.0 plus that figure, capped at 20.00; for journals without one it is assigned from publisher information and an evaluation of scientific content.
Because several organisations sell official-sounding metrics unrelated to the Clarivate figure. If you cannot identify who calculated a number and find the method, treat it as marketing rather than a metric.
It should be one input among several, and rarely the first. Scope, verifiable indexing, a described review process and registered DOIs decide whether your paper is published and found; a metric does not.
No, and this is the most damaging confusion. The impact factor describes the journal, averaged across all its articles. Your paper's own citations are what count for you.
The metrics this one is most often confused with:
Created by Vikram Choudhary • 09 Aug 2026
P-ISSN: 2664-844X
E-ISSN: 2664-8458

International Journal of Agriculture and Food Science